
AutoSpectral: New Features
- olivertburton

- Mar 20
- 4 min read
I will try to use this page to track changes to AutoSpectral that introduce new features or improvements that are noteworthy. This will mirror this page on GitHub.

Spectral QC
Status: coming in version 1.5.0
When running get.fluorophore.spectra(), you should receive a pdf document in folder figure_spectra to help you do some quality control and assess how well the fluorophore spectra have been identified in AutoSpectral. This report shows you your fluorophore signature plotted in overlay on top of a reference signature for that fluorophore from the same cytometer. Additionally, cosine similarity between your example and the database reference is calculated, and this value is used to flag potential problems when the match is poor. Obviously, this isn't going to be perfect because it won't be the same exact machine as used to acquire your samples, but it should help. Also, I don't have examples of every fluorophore on every machine. If you get "No reference available" and are willing to share your spectral profile(s), please head over to the Google sheet and copy-paste in your spectrum for the relevant cytometer. Thanks!


Databases for fluorophore spectra:
-------------------------------------
Markers and Fluorophores
Status: Available now
If you get "No match" when running create.control.file() for any of your fluorophores or markers, this is an opportunity for you to help improve AutoSpectral. This matching depends on spreadsheets containing the information about the fluorophores (where they emit on different cytometers, what they're called) and markers (what they're called, any synonyms or other ways of writing them). So, if you're using a new dye that I haven't added in, or some cool marker that I haven't used, please head over to the Google sheets for these and add them!
It may also help you to visit the Cytometer Database, which lists the names of the detector channels on each machine.
-------------------------------------
Autofluorescence QC
Status: coming in version 1.5.0
Sometimes your unstained sample isn't so "unstained". If your unstained sample actually has some fluorophore signal(s) in it, perhaps from your single-stained controls, then those can be treated as autofluorescence (AF) signatures. This would be true in any system, not just AutoSpectral, but AutoSpectral is very sensitive and quite powerful in extracting AF, so it's likely to matter more here.
Verision 1.5.0 incorporates a check when running get.af.spectra() to identify any AF signatures that are essentially identical (cosine similarity 0.995 or higher) to those in your fluorophore spectra. These are excluded, and you get a report in folder figure_autofluorescence showing an overlay of the relevant AF and fluorophore pair.
Here's a mock-up showing what this report looks like. For this example, I've pretended the median AF signature is a fluorophore, so we have lots of very similar AF spectra being generated by get.af.spectra() that would be excluded (note that this doesn't happen normally).


Why might you get fluorophores in your unstained? Your sample might actually be from cells that express a fluorescent reporter, you might have previously stained the cells and put them back in culture (think cell sorting) or you might have accidentally added a reagent to the well (e.g., Brilliant Stain buffer, which is fluorescent). The most common cause I've run into is contamination during the acquisition or staining process. This can be from carryover on the sample intake line, but most commonly happens in plates due to physical transfer of sample between adjacent wells. This is particularly the case with instruments that use orbital shaking to mix the samples. How can you combat this?
Place your unstained sample well away from any stained samples. It's generally good practice to separate your single-stained wells as well.
Prepare multiple unstained samples (they're cheap) as back-ups (also useful if you mess up any single-stained controls).
Limit the volume in your wells. I like to use plates that hold 300ul and only put 150ul in each well.
Use plates with "chimney" wells (see paper here) and definitely avoid plates without a lip at the top of the well.
Check how you personally are doing when discarding fluid from wells in wash steps. If you are flicking out the liquid after centrifugation, examine where it goes. A good test is to use something colored like Trypan Blue in every other well, flick and check--do you get blue droplets in other wells? I plate my samples in every other row (horizontally) because I flick upwards from H to A; you may find you want to use every other column if you discard right to left.
-------------------------------------
More Autofluorescence Extraction
Status: currently available
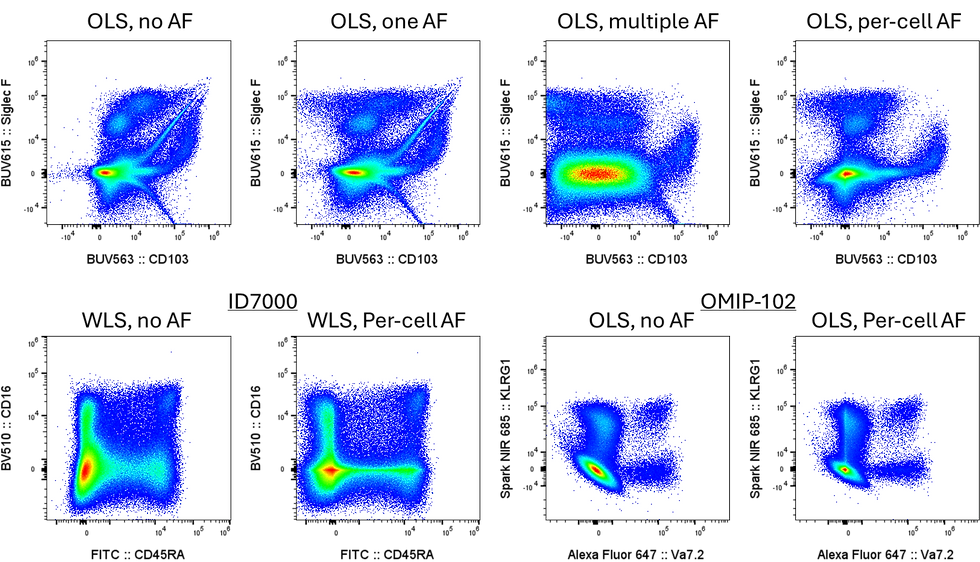
As of version ~1.1.0, AutoSpectral offers a "refine" option when identifying AF spectral profiles for AF extraction. This is intended to help capture that last percent or so of "problem" cells that remain far from zero in an unstained sample when unmixed using AutoSpectral's per-cell AF extraction. To use this, set "refine=TRUE" when running get.af.spectra(). Otherwise, the behaviour will remain as before.
This will be most useful in settings where you have many diverse AF profiles, such as tissue samples. It is unlikely to be necessary for PBMCs. This is being implemented now because the extraction of AF is much less dependent, computationally, on the number of AF spectra provided. It's no longer linear, and is much, much faster.
The basic idea here is that we run a first pass of SOM clustering on the unstained sample, identifying AF profiles. Then, we run the same unstained sample through the per-cell AF extraction process, and identify which cell/points remain far from the origin. These are points that haven't had their underlying AF profile extracted adequately. We then run a second round of clustering on those points only, isolating more AF signatures, trying to identify what precisely would be needed to bring those close to zero (where they should be in an unstained sample).
As part of this, you get a plot showing you the impact of the AF extraction on the unstained sample. AutoSpectral automatically picks what it thinks are the two worst channels (the ones most affected by AF at the beginning, not necessarily the ones that most improved, but usually so). Here's an example of unstained mouse lung:

-------------------------------------
Comments